Read the full Part 4 article; this article is the supplementary material for Part 4.
Climate Zones & Regions: Data Sources Reference
This document provides validated official data sources for climate zone and region classification in North American utility climate vulnerability assessments.
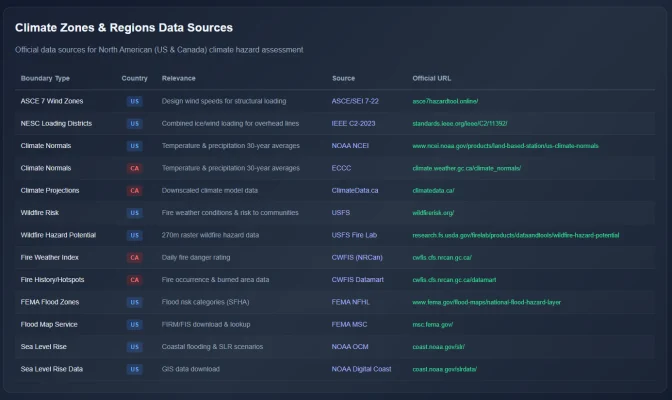
Updated Data Sources Table
Detailed Source Descriptions
1. Wind Loading Data
United States: ASCE 7-22
Official URL: https://asce7hazardtool.online/
The ASCE Hazard Tool provides site-specific structural design parameters per ASCE/SEI 7-22, including:
- Basic wind speeds for Risk Categories I–IV
- 3-second gust speeds at 33 ft (10 m) elevation
- Exposure Category C (open terrain)
- Special wind regions requiring site-specific analysis
Key Features:
- Interactive lookup by coordinates or address
- Returns wind speeds for multiple return periods (MRI)
- Hurricane-prone region identification
- Wind-borne debris region delineation
United States: NESC Loading Districts (IEEE C2-2023)
Official URL: https://standards.ieee.org/ieee/C2/11392/
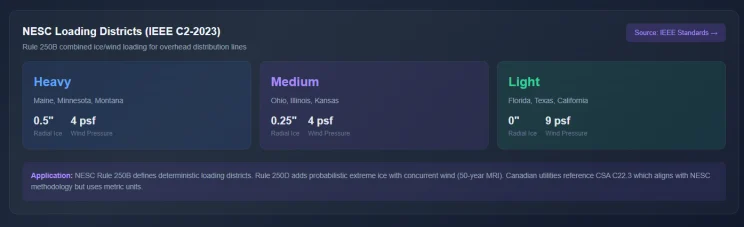
The National Electrical Safety Code defines three loading districts for overhead line design:
| District | Radial ice | Wind pressure | Temperature |
|---|---|---|---|
| Heavy | 0.5 in (12.5 mm) | 4 psf | -20°F |
| Medium | 0.25 in (6.5 mm) | 4 psf | +15°F |
| Light | none | 9 psf | +30°F |
Rule 250B defines deterministic district loads; Rule 250D adds probabilistic extreme ice with concurrent wind (50-year MRI).
2. Climate Normals
United States: NOAA NCEI
Official URL: https://www.ncei.noaa.gov/products/land-based-station/us-climate-normals
1991-2020 Climate Normals available for 9,800+ stations including:
- Monthly/annual temperature and precipitation
- Heating/cooling degree days
- Growing season statistics
- Extreme event frequencies
Access Methods:
- Interactive map: https://www.ncei.noaa.gov/maps/normals/
- Bulk download: https://www.ncei.noaa.gov/access/us-climate-normals/
- API access via Climate Data Online (CDO)
Canada: Environment and Climate Change Canada (ECCC)
Official URL: https://climate.weather.gc.ca/climate_normals/
1991-2020 Canadian Climate Normals for 700+ composite stations:
- Temperature (daily max/min/mean)
- Precipitation (rain, snow, total)
- Degree days and wind chill
- Frost-free period
Supplementary Portal: https://climatedata.ca/
- CMIP5/CMIP6 downscaled projections
- Station data download
- Climate indices and variables
3. Wildfire Risk Data
United States: USFS Wildfire Risk to Communities
Official URL: https://wildfirerisk.org/
Download Portal: https://wildfirerisk.org/download/
Comprehensive wildfire risk assessment including:
- Risk to Homes (integrated likelihood × intensity × consequences)
- Burn Probability (annual probability of fire)
- Conditional Risk to Potential Structures
- Flame Length (4ft and 8ft exceedance probability)
- Risk Reduction Zones (Direct/Indirect/Minimal Exposure)
Data Format: 30m raster (GeoTIFF), available by state from Forest Service Research Data Archive
United States: Wildfire Hazard Potential
Official URL: https://research.fs.usda.gov/firelab/products/dataandtools/wildfire-hazard-potential
270m national-scale index integrating:
- Fire simulation (FSim) burn probability
- LANDFIRE 2020 fuels data
- Historical fire occurrence (1992–2020)
Five hazard classes: Very Low, Low, Moderate, High, Very High
Canada: Canadian Wildland Fire Information System (CWFIS)
Official URL: https://cwfis.cfs.nrcan.gc.ca/
Datamart: https://cwfis.cfs.nrcan.gc.ca/datamart
Canadian Forest Fire Weather Index (FWI) System components:
- Fine Fuel Moisture Code (FFMC)
- Duff Moisture Code (DMC)
- Drought Code (DC)
- Initial Spread Index (ISI)
- Buildup Index (BUI)
- Fire Weather Index (FWI)
Available Data:
- Daily fire weather maps (current & archived)
- National Fire Database point data (shapefile)
- Satellite hotspot detections
- Fire perimeter estimates
4. Flood Hazard Data
United States: FEMA National Flood Hazard Layer (NFHL)
Official URL: https://www.fema.gov/flood-maps/national-flood-hazard-layer
NFHL Viewer: https://hazards-fema.maps.arcgis.com/apps/webappviewer/index.html?id=8b0adb51996444d4879338b5529aa9cd
Map Service Center: https://msc.fema.gov/
GIS Access:
- County/State NFHL downloads (geodatabase format)
- Web Map Service (WMS) for application integration
- REST API endpoints
United States: NOAA Sea Level Rise Viewer
Official URL: https://coast.noaa.gov/slr/
Data Download: https://coast.noaa.gov/slrdata/
Coastal inundation scenarios from 0.5 to 10 ft above MHHW:
- Inundation extent (raster depth grids)
- Hydrologically connected flooding
- Low-lying unconnected areas
- Mapping confidence layers
- Marsh migration projections
- High tide flooding frequency
Coverage: All U.S. coastal states except Alaska and Great Lakes
Integration Notes for Utility Applications
Spatial Reference Systems
- FEMA NFHL: NAD83 Geographic or State Plane projections
- NOAA SLR: NAD83 / NAVD88 vertical datum
- USFS Wildfire: NAD83 Albers Equal Area
- CWFIS: NAD83 Lambert Conformal Conic
Common GIS Operations
- Intersection Analysis: Asset geometries ∩ Hazard zones
- Spatial Join: Attach hazard attributes to asset points/lines
- Buffer Analysis: Proximity to hazard boundaries
- Zonal Statistics: Aggregate hazard values by service territory
Data Quality Considerations
- FEMA FIRM accuracy: ±38 ft horizontal (rural), ±10 ft (urban)
- SLR Viewer: Based on LiDAR DEM quality (varies by region)
- USFS Wildfire: 30m resolution adequate for planning-level analysis
- CWFIS FWI: Daily resolution, station-based interpolation
Sample Data Visualization
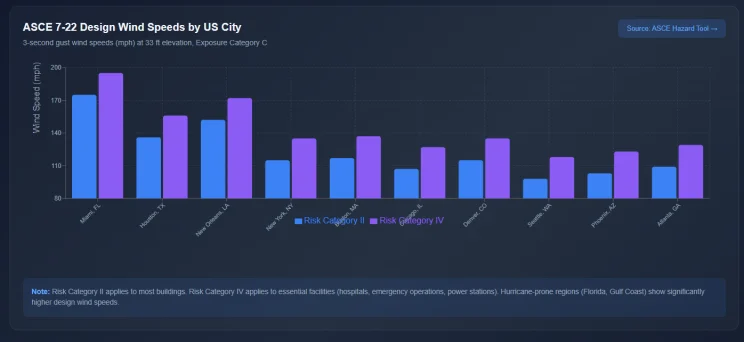
ASCE 7-22 Wind Speeds — Bar chart comparing Risk Category II and IV wind speeds for major US cities
NESC Loading Districts — Summary cards with ice/wind loading parameters
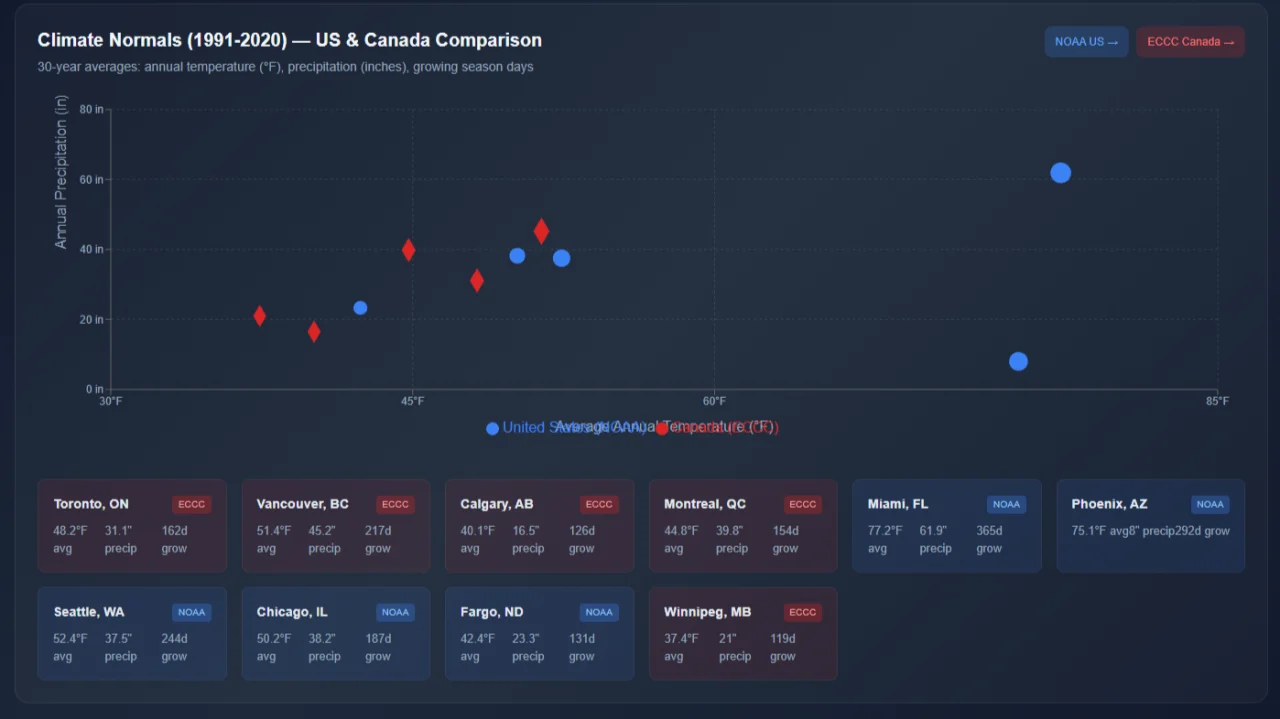
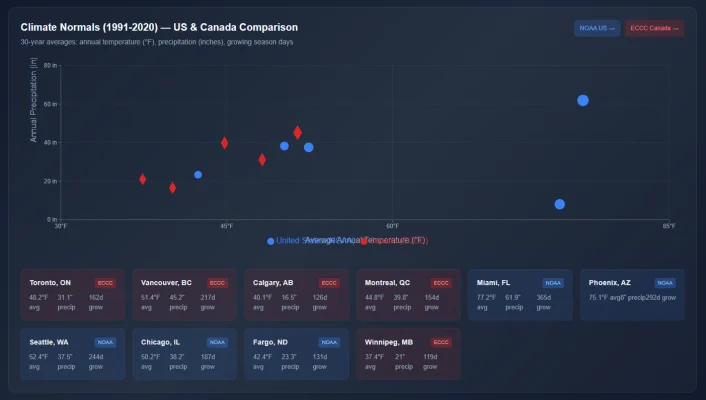
Climate Normals Comparison — Scatter plot of US (NOAA) and Canadian (ECCC) station data
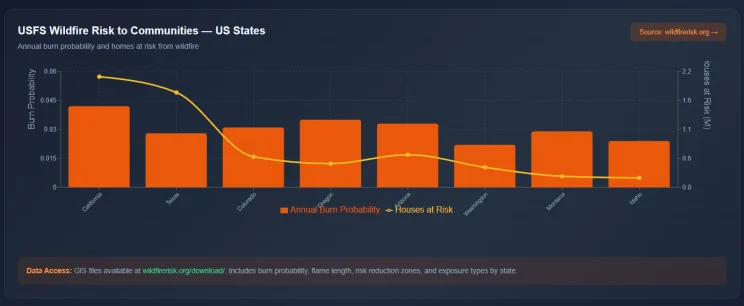
USFS Wildfire Risk — Combined bar/line chart of burn probability and homes at risk
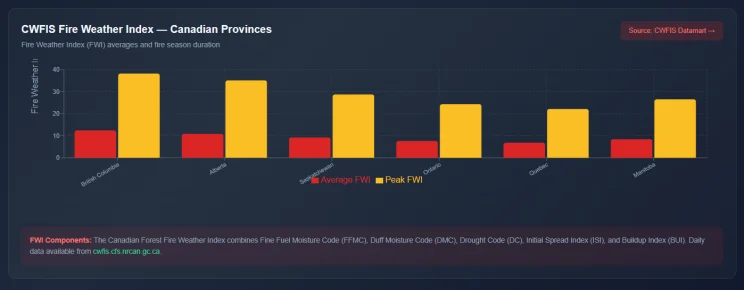
CWFIS Fire Weather Index — Bar chart of average and peak FWI by province
References
- ASCE/SEI 7-22. Minimum Design Loads and Associated Criteria for Buildings and Other Structures. American Society of Civil Engineers, 2022.
- IEEE C2-2023. National Electrical Safety Code. Institute of Electrical and Electronics Engineers, 2023.
- NOAA NCEI. U.S. Climate Normals (1991-2020). https://www.ncei.noaa.gov/products/land-based-station/us-climate-normals
- Environment and Climate Change Canada. Canadian Climate Normals 1991-2020. https://climate.weather.gc.ca/climate_normals/
- USDA Forest Service. Wildfire Risk to Communities. https://wildfirerisk.org/
- Natural Resources Canada. Canadian Wildland Fire Information System. https://cwfis.cfs.nrcan.gc.ca/
- FEMA. National Flood Hazard Layer. https://www.fema.gov/flood-maps/national-flood-hazard-layer
- NOAA Office for Coastal Management. Sea Level Rise Viewer. https://coast.noaa.gov/slr/