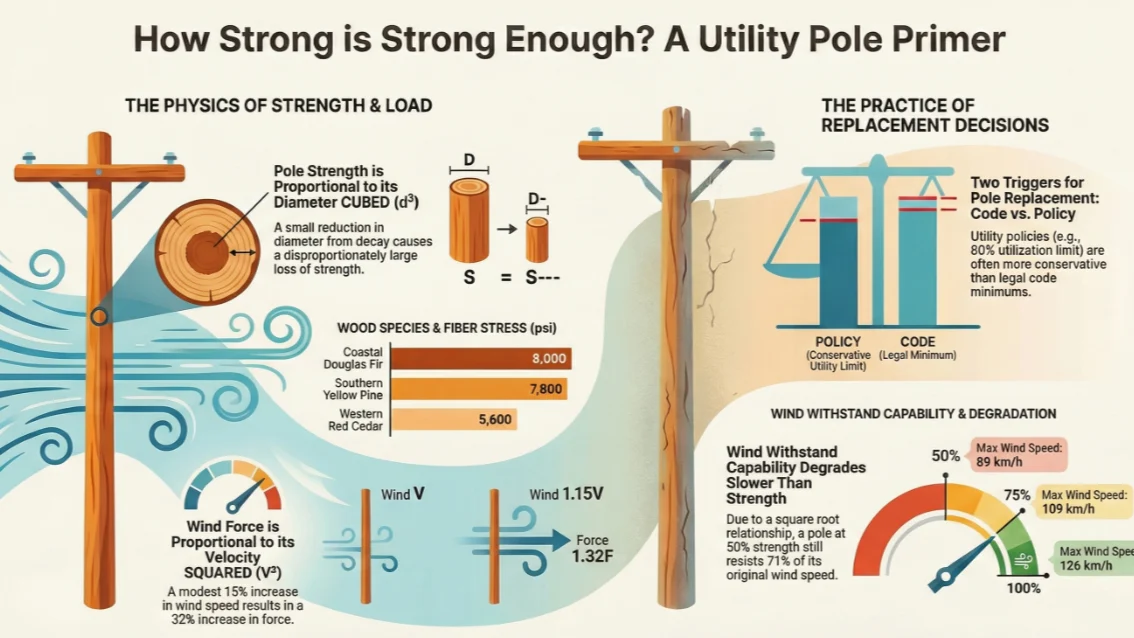
A thinking journey through the engineering fundamentals that connect pole design, inspection, and replacement decisions to climate risk.
Series Overview
This series explores how utilities can integrate climate science into infrastructure planning and asset management. Each part builds on the previous.
| Part | Focus | Key question |
|---|---|---|
| Part 0 | Pole strength fundamentals | How do we measure strength, and when do poles need replacement? |
| Part 1 | Extreme value statistics | How do we quantify a "50-year wind" from historical data? |
| Part 2 | Climate projections | How will climate change shift extreme weather intensities? |
| Part 3 | Compound hazards & fragility | How do multiple hazards interact, and how does load become damage? |
| Part 4 | Exposure analysis | Which assets actually face each hazard? |
| Appendix | Data sources | Where do North American climate and hazard data come from? |
| Appendix | Framework reconciliation | How do EAE and climate PoF plug into CNAIM risk? |
The goal is to connect engineering practice (SPIDAcalc, inspection programs, replacement thresholds) with climate science (GEV distributions, CMIP6 projections, return levels) in a way that supports practical decision-making.
The Starting Question
"How do we know if a utility pole is strong enough to survive a storm?"
Answering this question requires understanding a chain of connected concepts: material strength, wind physics, design standards, and field measurements. Let's walk through this step by step.

Step 1: What Makes a Pole Strong?
A utility pole acts like a cantilever beam—fixed at the ground, free at the top. When wind blows, it creates a bending force that tries to snap the pole at its weakest point, typically the ground line.
"In making the calculations, it was assumed that the pole is used as a simple cantilever and that the maximum fibre stress in the pole subjected to the bending moment applied will occur at the groundline." — CSA O15-15, Annex B.1.2
The pole's ability to resist this bending is its Resisting Moment (Mᵣ):
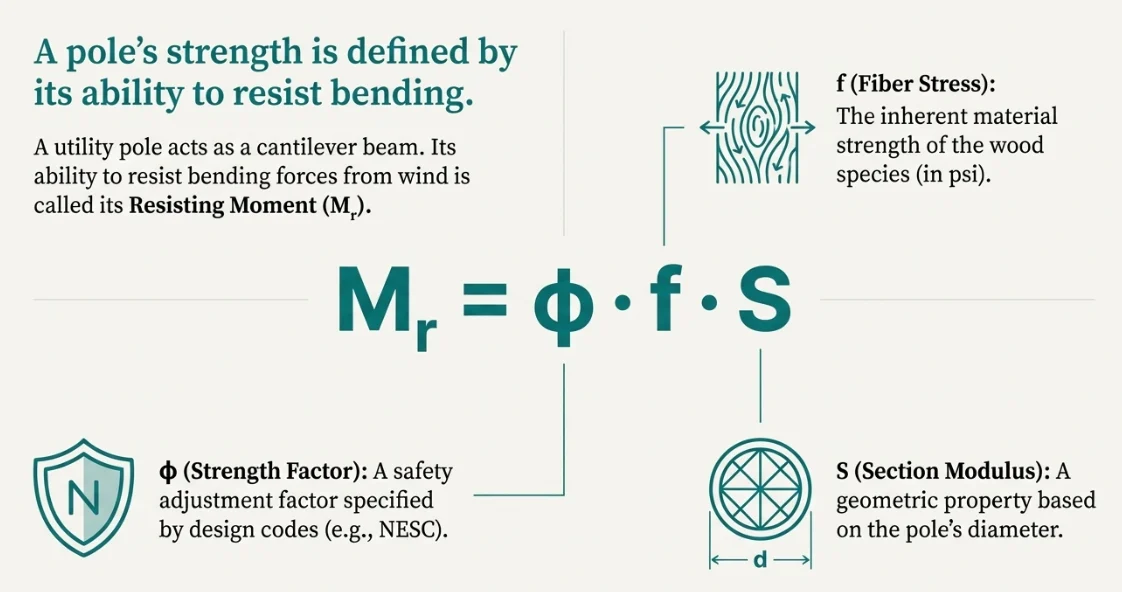
Where:
- f = Fiber Stress (psi) — The material strength of the wood species
- S = Section Modulus — A geometric property: S = π·d³/32 for circular poles
- φ = Strength Factor — A code-specified safety adjustment (0.65 to 0.85 depending on construction grade)
Fiber Stress by Species
Different wood species have different strengths, specified in CSA O15-15 Table 3.
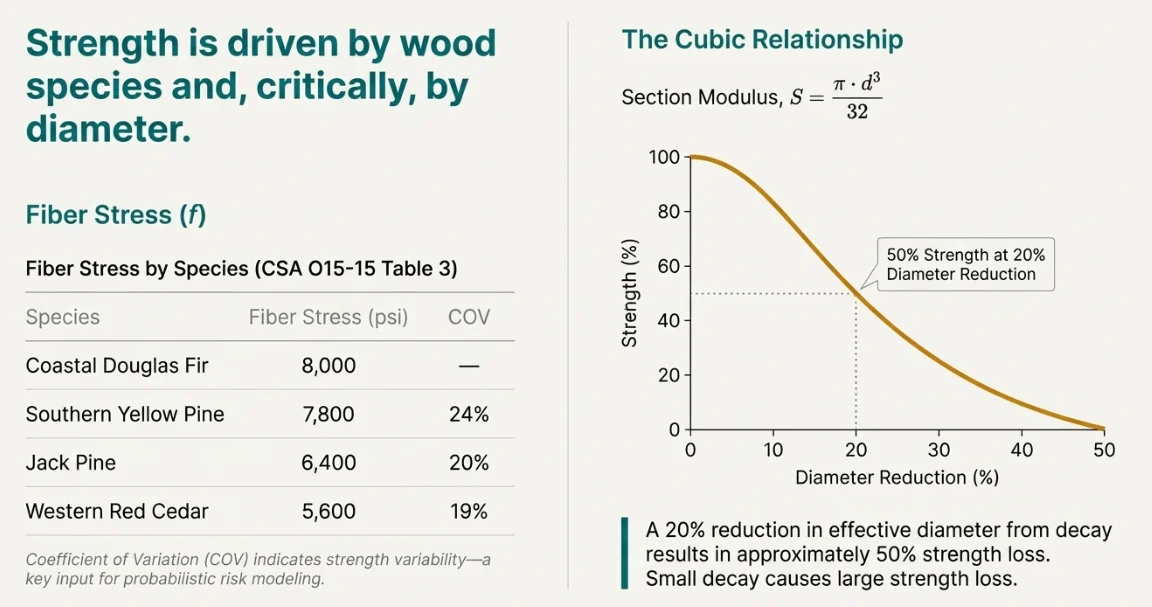
The Coefficient of Variation (COV) indicates strength variability—higher values mean greater uncertainty in predictions, which matters for probabilistic risk assessment.
The Cubic Relationship
Because strength depends on diameter cubed (d³), small reductions from decay cause disproportionate strength loss. A 20% reduction in effective diameter results in approximately 50% strength loss.
Technical note: The groundline failure assumption is valid when groundline circumference is at most 1.5× the circumference at the loading point. For highly tapered poles, the critical section may be above groundline (CSA O15-15, Annex B.1.3).
Step 2: How Does Wind Become a Load?
We measure wind in km/h, but often we also work with pressure in lb/ft² or Pa. The conversion follows:
P = 0.00256 × V² (P in lb/ft², V in mph)
The complete formula includes terrain, height, and gust factors:
P = 0.00256 × V² × kz × GRF × I × C
Practical examples:
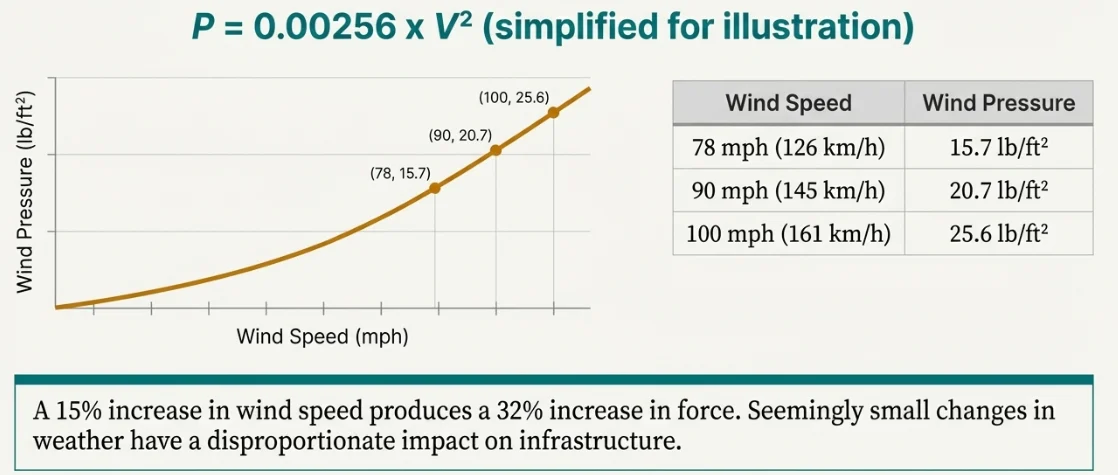
The key insight: pressure scales with velocity squared.
Step 3: Pole Classes and Design Standards
Pole classes are defined in CSA O15-15 and ANSI O5.1 based on horizontal tip load capacity:
"The term 'class' as used in this Standard does not refer to quality limitations or defects of a pole or reinforcing stub; it is used to differentiate poles and stubs on the basis of their potential force-resisting capabilities." — CSA O15-15, Table 3, Note 5d
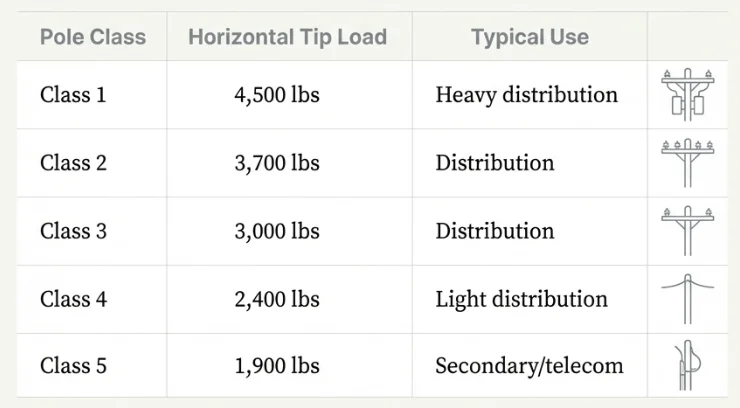
The design wind speed represents the maximum wind a new pole can withstand with appropriate safety margins.
Step 4: The Design Equation
Codes like NESC use a dual-factor approach rather than simple percentage utilization.
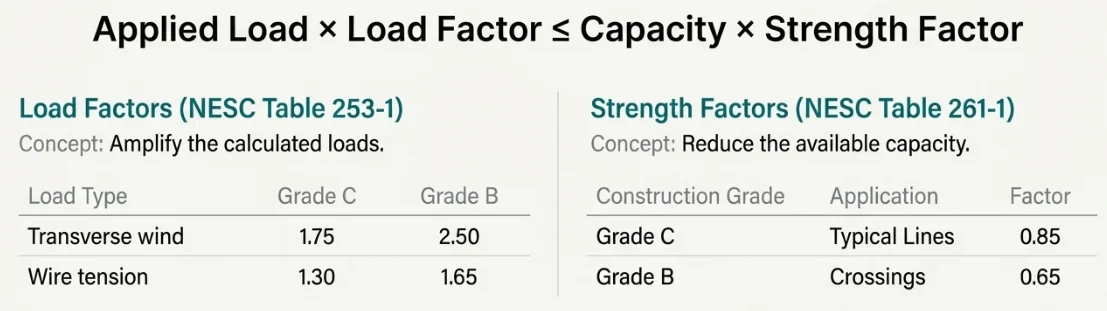
This dual-factor approach provides built-in safety margin. This concept is important for the rest of the discussion. Make sure you read it a few times.
The Key: Load Factors Create the Margin
The NESC design equation isn't just "Load ≤ Capacity." It's:
Load × Load Factor ≤ Capacity × Strength Factor
For Grade C, combined loading (Rule 250B), the Load Factor is 1.75:
Load × 1.75 ≤ Capacity × 0.85
Rearranging for minimum required capacity:
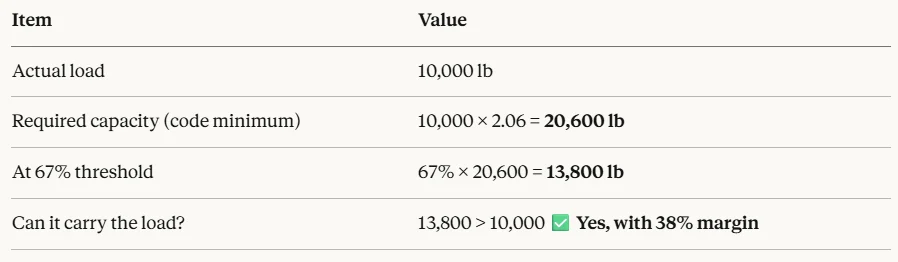
Required Capacity = (Load × 1.75) / 0.85 = Load × 2.06
So a pole meeting code minimum has 2.06× the actual load as capacity. This can be considered the built-in safety margin prior to our utilization % used during the engineering design.
Two Cases: Combined Loading vs. Extreme Wind
Case 1: Combined Loading (LF = 1.75)
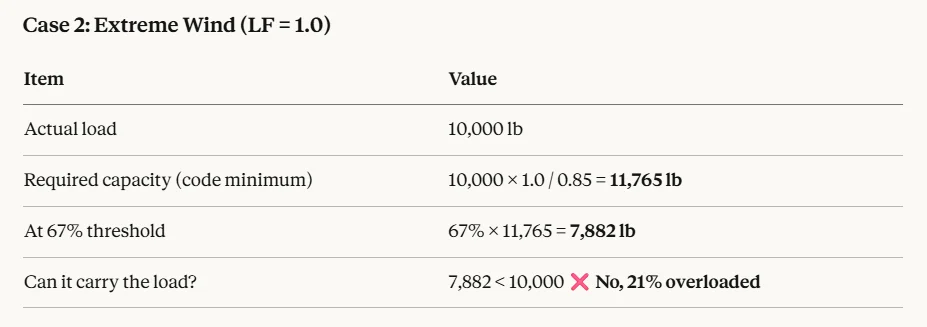
Case 2: Extreme Wind (LF = 1.0)
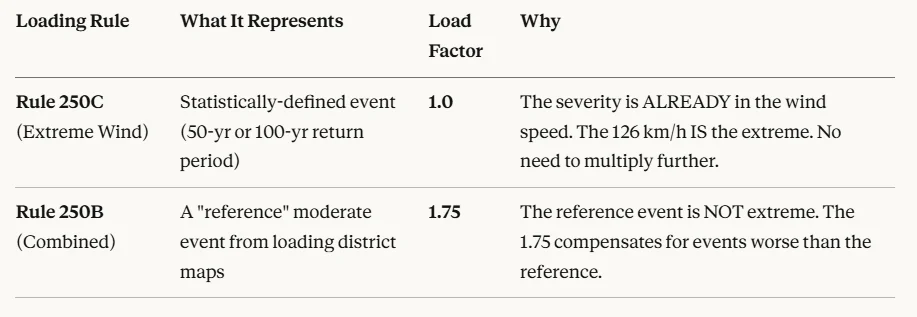
Why Load Factor = 1.0 for Extreme Wind (The Counter-Intuitive Part)
The Load Factor is not about "how severe is the weather." It's about how much uncertainty exists in the load calculation itself.
Step 5: Remaining Strength and Wind Withstand
As poles decay, their capacity drops. The relationship between remaining strength and wind withstand capability follows a square root rule:
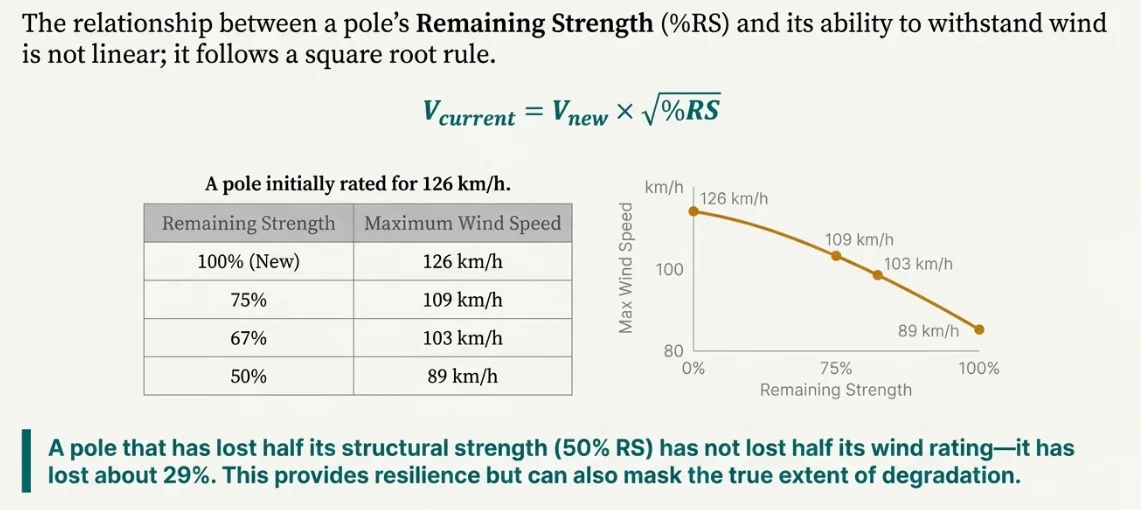
The square root relationship means degradation is more gradual than intuition suggests. A pole at 50% strength hasn't lost 50% of its wind rating—it's lost about 29%. This is both reassuring (poles degrade gracefully) and a potential trap (capacity loss may be underestimated).
Step 6: Replacement Thresholds — Two Parallel Frameworks
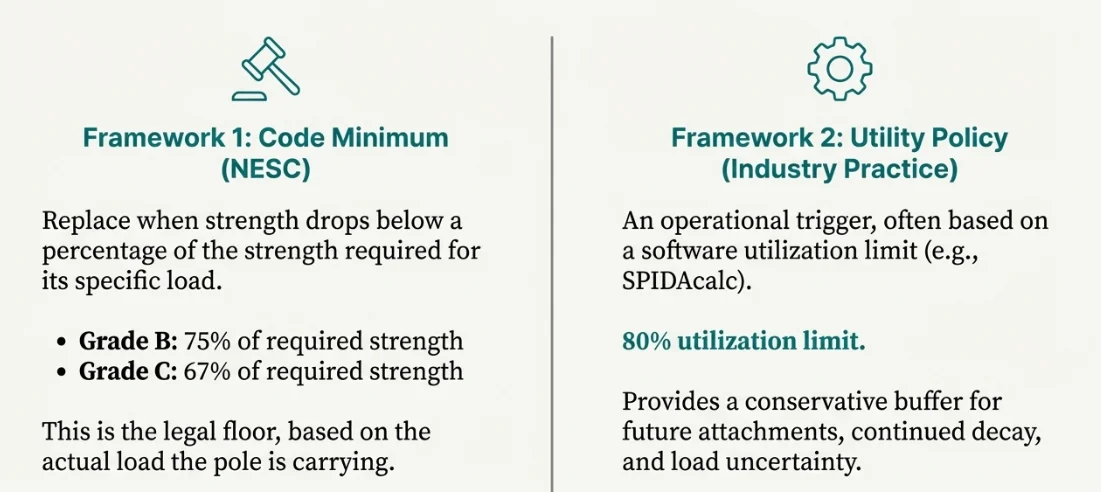
Here's where practice gets nuanced. There are two parallel frameworks that can be used to govern replacement decisions:
Framework 1: Code Requirements (NESC Table 261-1)
The NESC specifies replacement when strength drops below a threshold of "that required when installed."
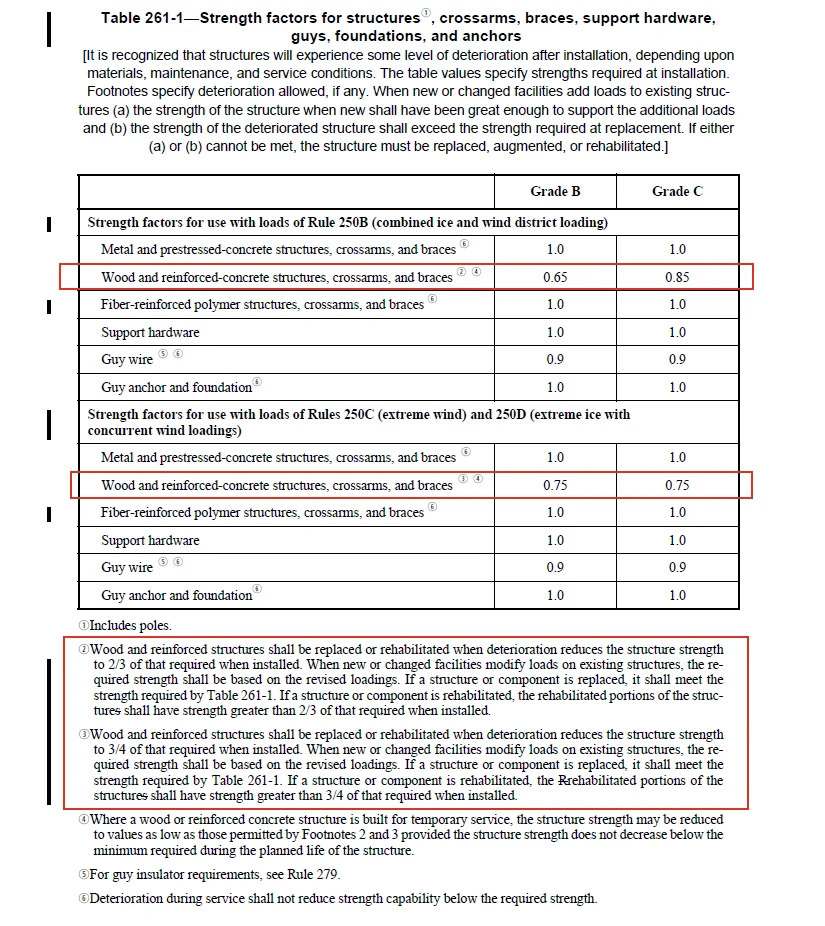
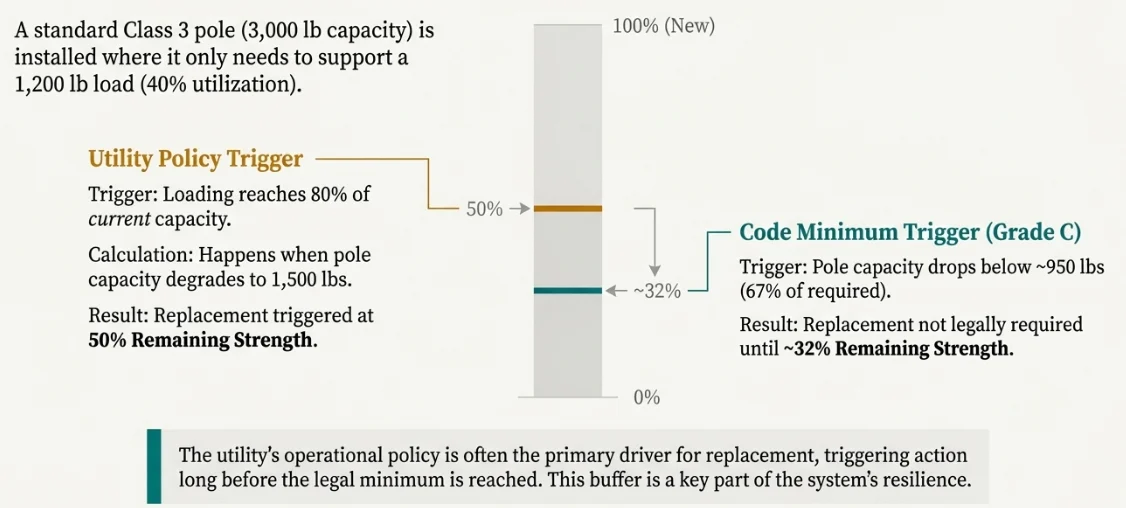
The critical phrase is "required when installed"—this means the threshold applies to the load actually needed at that location, not the full pole capacity.
Framework 2: Utility Policy (Industry Practice)
Utilities may use an 80% utilization limit as their operational trigger. This is more conservative than code minimums and provides margin for:
- Future third-party attachments
- Continued decay between inspections
- Load uncertainty and construction variability
Why This Distinction Matters
For an "over-designed" pole (common in practice), these frameworks trigger at very different points.
Example: Class 3 pole (3,000 lb capacity) designed at 40% utilization.
Step 7: The Lifecycle View
Pulling these concepts together, here's how a typical pole progresses through its service life:
DESIGN PHASE
├── Select pole class (CSA O15 / ANSI O5.1)
├── Apply load factors and strength factors
├── Target 20%-60% utilization (industry practice)
└── Document design basis
        ↓
INSTALLATION (Year 0)
├── 100% physical strength
├── ~40% SPIDAcalc loading (assumed typical)
└── Full design wind capacity
        ↓
SERVICE LIFE (Years 1-30)
├── Ground-line decay progresses
├── Attachments may be added (make-ready)
└── Periodic visual patrols
        ↓
DETAILED INSPECTION (Year 25+)
├── Resistograph or boring test
├── Result: e.g., 75% remaining strength
├── Recalculated loading: 53% (40%/0.75)
└── Decision: Continue monitoring
        ↓
UTILITY TRIGGER (Year 35-45)
├── Remaining strength: ~50%
├── Loading: 80% → Policy limit reached
├── Options: Reinforce (stub) or replace
└── Decision driven by utility policy
        ↓
REPLACEMENT
├── New pole installed
├── Cycle restarts
└── Consider: Should design account for climate projections?
Triggering remaining-strength replacement threshold calculation: RS_threshold = θ × U₀
Where:
- θ = Code threshold (0.67 for Grade C, 0.75 for Grade B)
- U₀ = Original utilization for that loading case (assume 40%)
For Grade B: Replacement Threshold = 3/4 × 0.4 = 30%
For Grade C: Replacement Threshold = 2/3 × 0.4 = 26.7%
Practical Implication (Edge Cases)
If your poles are designed primarily for combined loading (250B) and show 40% utilization, then yes:
- Grade B threshold: 30% remaining strength
- Grade C threshold: 26.7% remaining strength
But if extreme wind (250C) governs, the actual failure point is higher:
- Zero margin at 30.1% (for 40% utilization under 250C)
- Code threshold of 26.7% is too late
There are edge cases; utility policy should trigger replacement well before these edge cases become dangerous.
Step 8: Make-Ready Considerations
When new equipment is added to an existing pole, the "required strength" must be recalculated based on new total loading:
"When new or changed facilities add loads to existing structures (a) the strength of the structure when new shall have been great enough to support the additional loads and (b) the strength of the deteriorated structure shall exceed the strength required at replacement." — NESC Table 261-1, Preamble
This creates two tests:
- Was the pole adequate when new for the new loads?
- Does the deteriorated pole still exceed the threshold for the new required strength?
This is particularly relevant for telecom make-ready work, where a pole that passes inspection under current loading may fail under increased loading from new attachments.
Step 9: Inspection Methods
Field measurement of remaining strength uses various techniques.
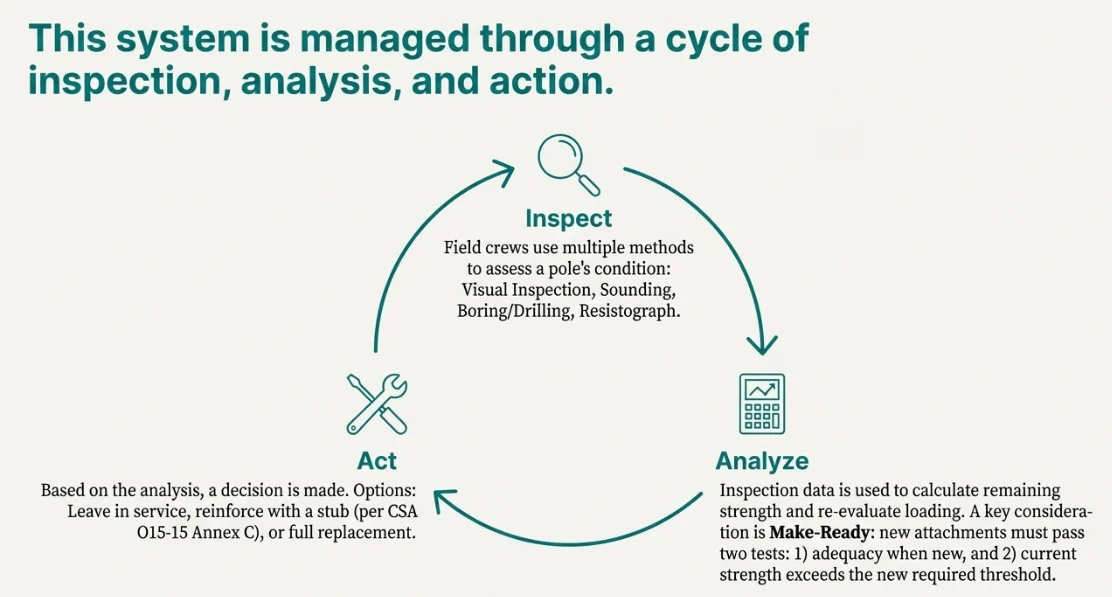
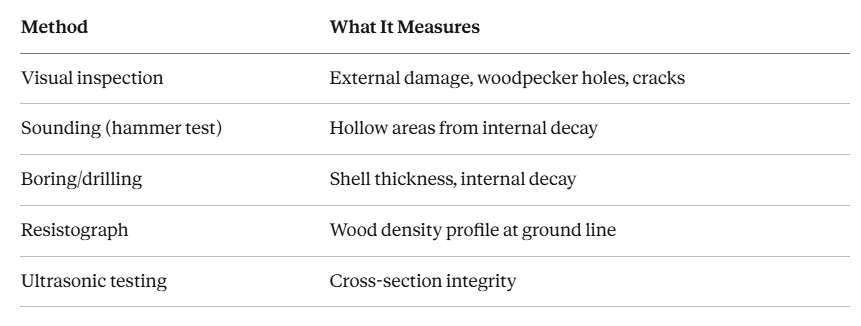
Codes specify the replacement outcome (the threshold) but leave inspection methods to engineering judgment. The workflow typically follows: visual patrol → detailed inspection → recalculation → decision.
The final question—whether new poles should be designed for future climate conditions rather than historical data—is what motivates the rest of this series: Part 1, Part 2, Part 3 and Part 4.
What's Next?
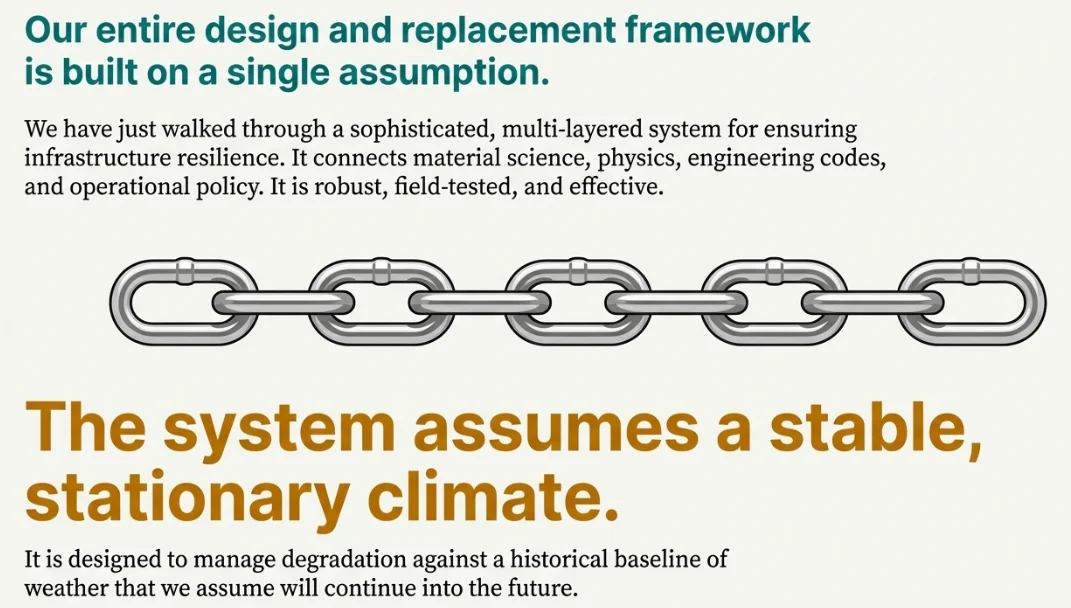
Everything in this article assumes design wind speed stays constant. But what if climate change increases extreme wind intensity?
Consider this scenario:
- A pole is designed for 126 km/h (current 50-year return level)
- Projections show the 50-year wind may reach 142 km/h by 2075
- That's a 12.7% wind speed increase
- But pressure increases by (1.127)² − 1 = 27%
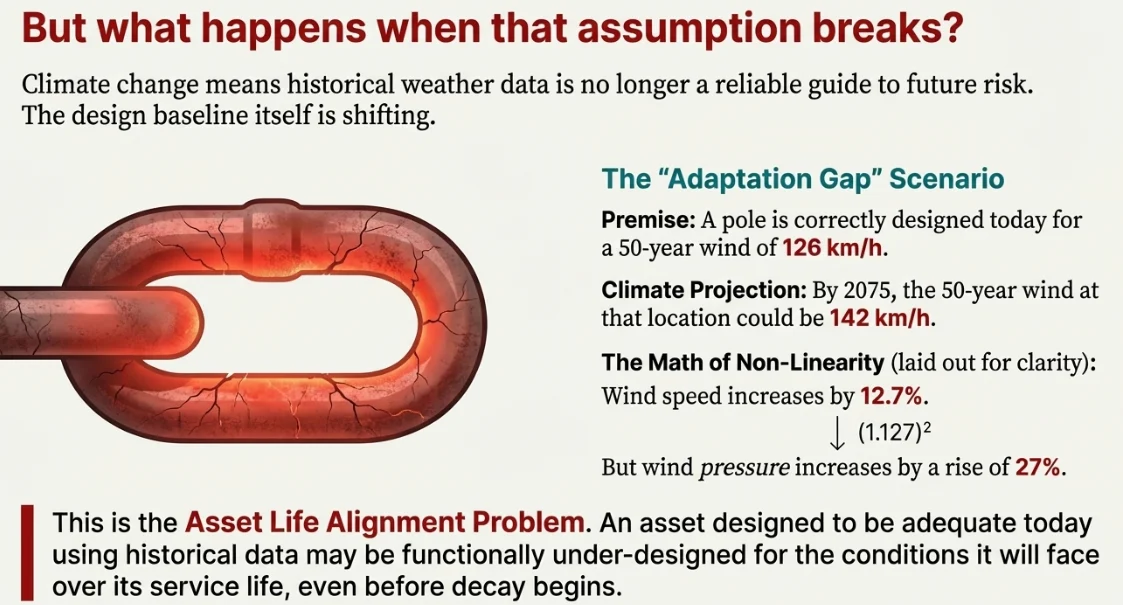
A pole that was "perfectly adequate" at 60% loading when new may be under-designed by 27% before it even starts to decay. This is the asset life alignment problem: infrastructure designed today using historical data will face different conditions by end-of-life.
Glossary
| Term | Definition |
|---|---|
| Resisting Moment (Mᵣ) | Internal bending strength of a pole (ft-lb or N-m) |
| Applied Moment (Mₐ) | Bending force from wind, wire tension, and equipment |
| Fiber Stress (f) | Material strength of wood (psi), per CSA O15-15 Table 3 |
| Section Modulus (S) | Geometric property relating diameter to bending resistance |
| Remaining Strength (%RS) | Current capacity as percentage of original |
| Required Strength | Minimum strength to meet code loading criteria: (Applied × LF) / SF |
| COV | Coefficient of Variation—statistical measure of strength variability |
| Grade B/C | NESC construction grades with different load/strength factors |
| Load Factor | Code multiplier applied to calculated loads |
| Strength Factor | Code multiplier applied to structure capacity |
| Return Level | Event intensity expected once every T years |
References
Standards:
- CAN/CSA-O15-15 — Wood utility poles and reinforcing stubs
- ANSI O5.1 — Specifications and Dimensions for Wood Poles
- NESC C2 (IEEE/ANSI C2) — National Electrical Safety Code
- RUS Bulletin 1724E-150 — Design Guide for Rural Electric Cooperative Pole Lines
Key Sections:
- CSA O15-15: Table 3 (fiber stress), Annex B (classification), Annex C (reinforcing stubs)
- NESC: Rule 260B1 (design), Table 253-1 (load factors), Table 261-1 (strength factors, footnotes w and e)
Continue to Part 1: Understanding Extreme Weather Events.